
.svg)

.jpg)


By Nita Kotecha, Senior Manager, Healthcare
The government says general practice has more GPs than ever. The profession says it is in crisis. Both are using the same dataset. The difference lies in which numbers they choose to cite, and that difference matters far more than most practice owners realise.
When NHS England workforce statistics are used to point to a GP workforce that has grown by over 3,400 full-time equivalents since 2016, that can be true depending on the measure used. When the BMA says that over 6,500 FTE GP partners have been lost since 2015, that is also true on its analysis of NHS England workforce data. Both statements describe the same decade of change in English general practice, but they paint entirely different pictures. Understanding where the real pressure sits requires looking at both.
Which GP numbers are actually rising?
The total FTE GP workforce in England stood at approximately 38,900 in April 2026. That figure includes partners, salaried GPs, locums and GPs in training grades. By September 2025, the number of fully qualified permanent GPs had edged above September 2015 levels for the first time, reaching 28,703 FTE. By May 2026, BMA data put the figure at 28,956.
On the surface, that recovery looks like progress. But it has been driven almost entirely by a surge in salaried GP recruitment. Between June 2024 and September 2025 alone, the salaried GP workforce grew by over 2,200 FTE, a rate of roughly 148 per month. By contrast, between September 2015 and December 2019, salaried GP numbers grew at just 25 per month.
The growth in salaried GPs is welcome. More clinical capacity is more clinical capacity. But salaried GPs do not carry the financial and operational risk of running a practice. They do not hold the GMS contract, manage the premises, employ the staff, or absorb the losses when costs outrun income. That responsibility still falls to partners, and the partner workforce has been in sustained decline for a decade.
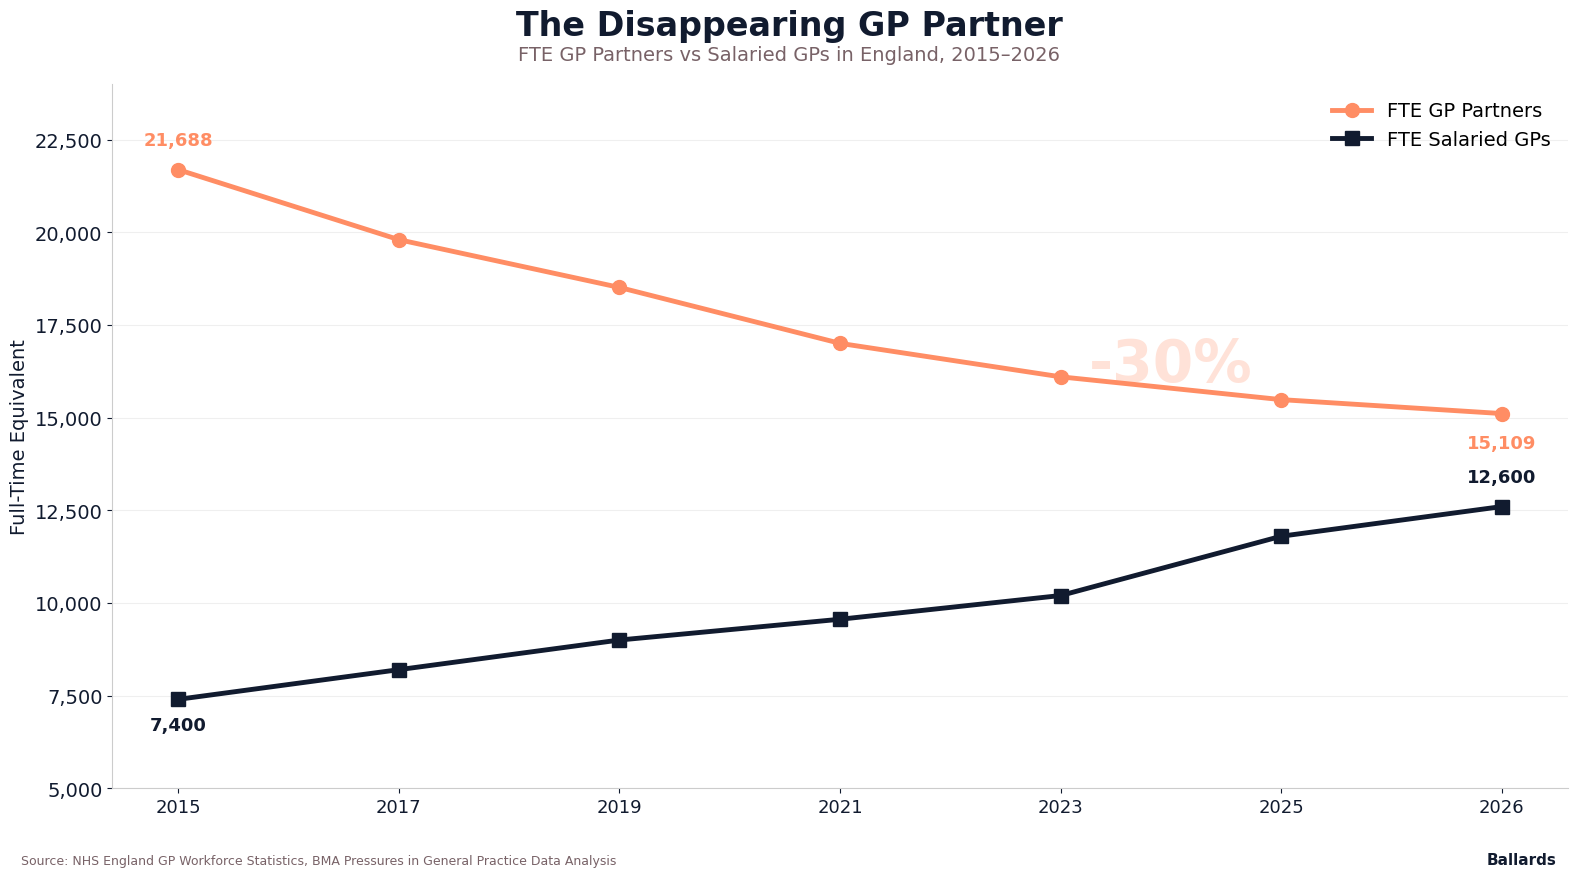
On BMA analysis of NHS England full-time equivalent workforce data, there were 21,688 FTE GP partners in England in September 2015. By May 2026, that figure had fallen to 15,109. That represents a loss of over 6,500 FTE partners in just over a decade, a decline of approximately 30%. The downward trend has not paused, plateaued, or reversed at any point. In the twelve months to May 2026 alone, a further 377 FTE partners left the model.
The Nuffield Trust’s headcount analysis captures the same structural consequence from a different angle: GP partners are now a minority of the GP workforce. Its figures show the number of GP partners falling by almost 25% between September 2015 and December 2024, while the number of GP partners aged under 40 dropped by 53%. The pipeline of new partners is not refilling the pipeline of those leaving, and the gap is widening.
"The total GP workforce is recovering. The partner workforce, the one that keeps practices open, is not. That distinction is everything."
Fewer practices, more patients
While the partner workforce has contracted, the patient population has moved in the opposite direction. In May 2026, there were 63.5 million patients registered with GP practices in England, an increase of 6.6 million, or nearly 13%, since 2015. A growing, ageing population with increasingly complex co-morbidities means that number will continue to rise.
At the same time, the number of practices has fallen. BMA analysis of NHS England data indicates that since 2015, 1,470 independent community GP practices have closed or merged, leaving just 6,153 across England as of May 2026. Nuffield Trust headcount analysis, using data to December 2024, records a similar direction of travel, with the number of GP surgeries falling by 18% over the decade. Some consolidation reflects deliberate merger strategy, but a significant proportion represents closures driven by the inability to recruit partners willing to take on the financial risk of running a practice.
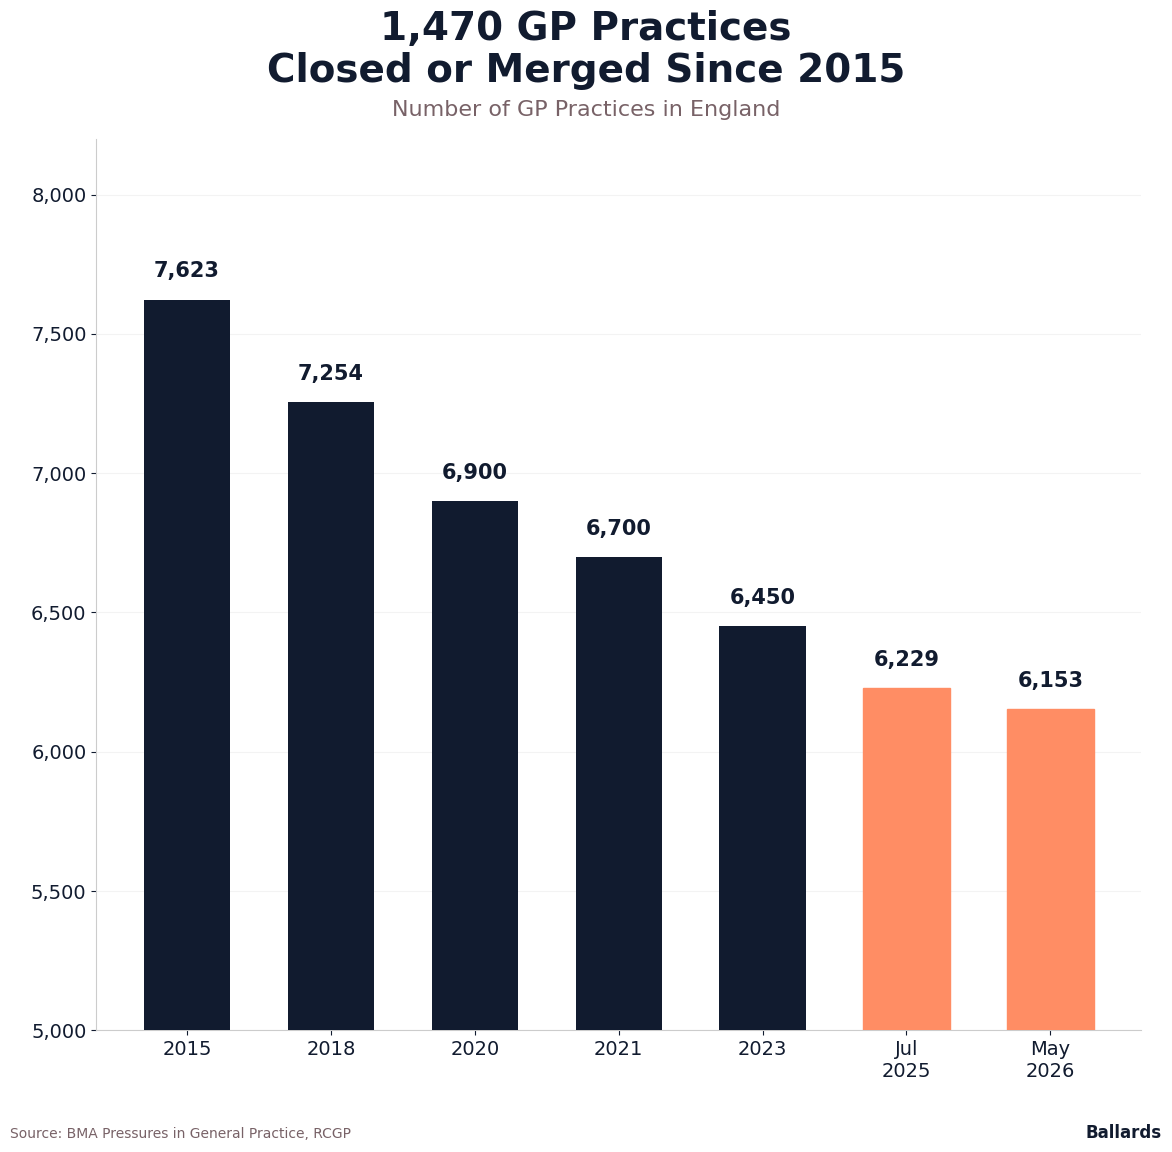
The arithmetic is straightforward. Fewer partners, fewer practices, more patients. The result is an intensifying workload concentration on those who remain, and a mounting financial exposure for the partnerships that are still operating.
What patients per GP really tells you
The ratio of registered patients to GPs is the metric that connects workforce data to lived experience. In December 2016, there were 1,981 patients per FTE fully qualified GP. By May 2026, that figure had risen to 2,192, an increase of more than 13 %. In London, the ratio is significantly worse: 2,450 patients per FTE GP, more than double the BMA’s recommended target of one GP per 1,000 patients.
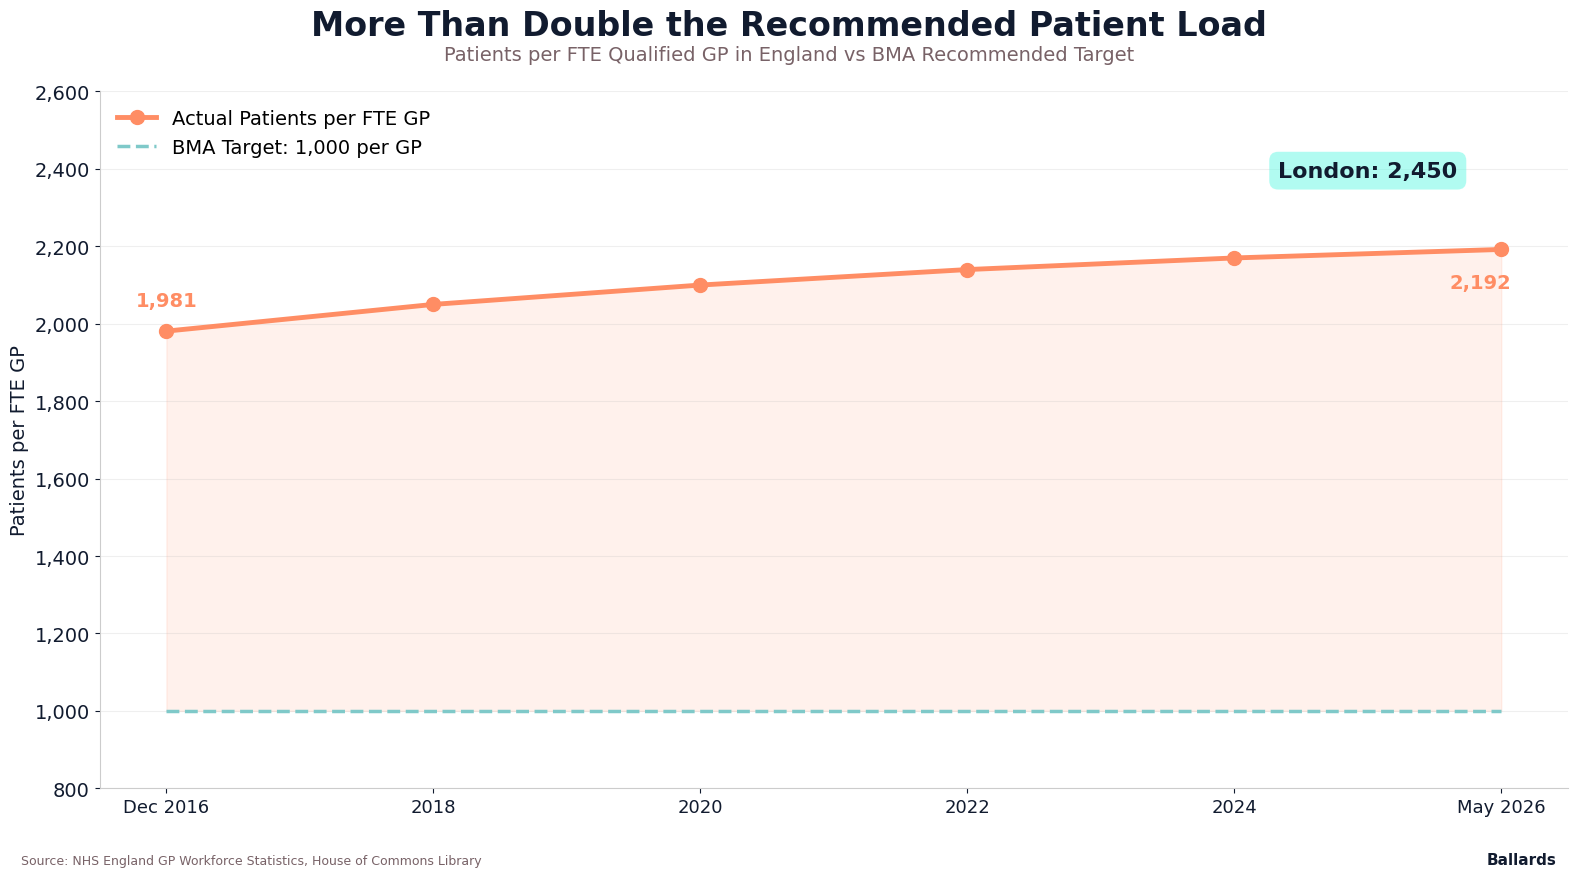
The Health Foundation’s modelling suggests that around 37,800 FTE GP posts would be needed by 2030/31 to deliver pre-pandemic standards of care. Under its current-policy scenario, the projected shortfall is around 8,800 FTE GPs, with a much larger shortfall under its pessimistic scenario and a materially smaller gap under its optimistic scenario. That would require sustained recruitment and retention improvements at a level significantly above anything achieved in the past decade. In conversations with practice partners, I find that few believe this target is realistic given current funding trajectories and the diminishing appeal of partnership.
The variation between practices is also widening. Research published in the British Journal of General Practice earlier this year found that the range of patients per qualified FTE GP across practices stretched from 1,357 at the fifth percentile to 5,559 at the ninety-fifth percentile in 2024, up from a range of 1,204 to 4,139 in 2015. The system is not just under strain; it is becoming more unequal.
What 381 million appointments look like
Over the twelve months to May 2026, NHS England’s Appointments in General Practice series recorded very high appointment volumes, with around 381 million standard appointments booked in general practice in England on the definition used in the underlying analysis. NHS England has separately reported more than 1.5 million appointments per working day over the latest year. Of those appointments, around 44% were delivered by a GP, with the remainder handled by nurses, pharmacists, physiotherapists and the expanding range of additional roles.
The mandatory introduction of online consultation systems has added a further layer of pressure. NHS England reported 83 million online consultation requests over the twelve months to February 2026, with February itself reaching 8.6 million submissions. If later monthly data are used, the exact peak month and volume should be checked directly against the relevant NHS England dataset before publication. A BMA survey of more than 1,300 practices found that 55% reported negative effects on patient care following the introduction of online consultation changes, 42% had reduced face-to-face appointments to manage the volume, and 74% saw an increase in overall workload.
The pattern in the data is clear. Patient demand is rising on a predictable, demographic curve. The GP workforce has recovered numerically but not structurally. The partners who bear the risk of meeting that demand are fewer than at any point on record. And the practices through which care is delivered are consolidating, not expanding.
What the data trajectory means for your practice
For practice owners, the workforce data is not background reading. It is a forward indicator of the pressures heading towards your accounts.
Every data point in this piece translates into a financial pressure that compounds over time. Fewer partners across the sector means a shrinking pool of people willing and able to buy into practices, which affects practice valuations and succession planning. Rising patient lists without proportionate partner recruitment means higher workload per partner, which affects drawings, retention and the sustainability of the working model. Practice closures and mergers in neighbouring areas often push displaced patients onto surrounding lists, accelerating the cycle.
I work with practices where the patient-to-partner ratio has shifted so significantly over the past five years that the remaining partners are carrying workloads that would have been unrecognisable a decade ago. The data in this piece is the sector-wide picture. But every practice has its own version of these numbers, and knowing your own position against the national trajectory is the starting point for any financial planning.
The workforce data does not tell practices what to do. But it does tell them what is happening, and it asks a question that every practice should be answering: given the direction these numbers are heading, is your current position sustainable? If you are not sure, the time to find out is before the next set of figures makes the question harder.
If your practice would benefit from specialist support with financial planning or workforce modelling, our healthcare team can help.
This article has been prepared for information purposes only. Formal professional advice is strongly recommended before making decisions on the topics discussed in this release. No responsibility for any loss to any person acting, or not acting, as a result of this release can be accepted by us, or any person affiliated with us.
Related content GP Contract 2026/27: Can Your Practice Afford It?


.jpg)
%20(1)%20(1).jpg)
.jpg)
.jpg)
.jpg)
.jpg)
.svg)
%201.svg)

